White Paper

Better Grow Lighting Starts With Better Light Distribution

Most lighting systems focus on how much light they produce. We focused on how evenly that light actually reaches your plants. This paper introduces a scalable lighting architecture — built for real grow rooms — that delivers more consistent light coverage and gives growers tighter control over their environment.

Modular Layout Framework Zonal Lighting Control Radiance-Based Optimization PPFD Uniformity
Read the White Paper

The Core Idea

Average light output doesn't tell the whole story

In indoor growing, it's not just about how much light you're putting out — it's about whether that light is actually reaching every part of your crop evenly.

Two lighting setups can have the same average light intensity and still produce very different results. One might spread light relatively evenly. The other might create bright, concentrated hotspots in the center of the room while leaving the edges dim. Even if the numbers look the same on paper, those two environments will grow very different crops.

This forces growers into an uncomfortable tradeoff. Turn up the lights to give the dim areas enough intensity, and the bright spots become too intense. Dial things back to protect the hotspot zones, and the dim areas fall even further behind. Either way, part of the room isn't getting what it needs.

This paper explores a different approach. Instead of designing each grow room as a one-off fixture puzzle, we developed a lighting system built from the ground up to spread light more evenly — giving growers more room to actually dial in their environment rather than constantly working around its limitations.

Side-by-side canopy-plane PPFD comparison showing a hotspot-dominated field versus a tighter, more uniform field.
Heat maps comparing canopy-level light distribution: a uniform field on the left versus the bright-center, dim-edge pattern common in conventional lighting setups.

The Framework

A system designed to work in any size room

Our approach combines three things that don't typically get designed together: precise fixture placement, zone-by-zone light control, and computer-simulated optimization. Together, they form a system that can scale to different room sizes without starting from scratch each time.

Smarter Fixture Placement

Rather than placing fixtures by eye or by rule of thumb, we use an automated layout generator to position light sources precisely based on room geometry. The underlying logic stays the same across different room sizes — which means the system is genuinely scalable, not just adaptable.

Zone-by-Zone Control

Fixtures are grouped into concentric rings — like layers of an onion — so light output can be adjusted independently for each zone. That means the center of the room can be dialed down slightly while the edges are pushed up, rather than forcing the entire room to run at the same level.

Simulation-Driven Tuning

We use Radiance — an industry-standard lighting simulation tool — to model exactly how light behaves in each room configuration. This lets us find the optimal intensity for each zone before anything is ever installed, and confirm the system will hit its uniformity targets at a specific target light level.

Diagram of the modular layout generator across square and rectangular rooms, showing how the same structural logic carries across different geometries.
An example layout produced by our automated placement tool, showing how the same spacing logic applies across different room geometries.
Illustration of concentric zone control showing ring-wise or zone-wise power assignment from center to edge.
A diagram showing how fixtures are grouped into concentric rings. Each ring can be tuned independently to even out light distribution from the center of the room to the edges.

Why It Matters

More even light means less wasted output

In practice, most growers cap their lights at a maximum intensity to avoid burning the brightest spots in the room. That means the shape of your light field directly determines how much of your system's capacity you can actually use.

We tested both systems under a shared cap of 1,000 μmol m⁻² s⁻¹ — a common upper limit in commercial grow operations. Under that cap, our system consistently delivered more of the allowed intensity as useful, room-wide output. Because the light field was more even to begin with, less of it had to be sacrificed to keep the bright spots in check.

We also saw a much tighter spread around the target light level. In plain terms: more of the canopy was operating right where it was supposed to be, rather than splitting between zones that were too bright and zones that weren't bright enough.

What the numbers showed

  • Our system's light variation (measured as coefficient of variation, or CV) ranged from just 1.62% to 5.58% across all tested rooms — meaning light intensity stayed very close to the target across the entire canopy.
  • The conventional multi-bar fixture layout ranged from 14.30% to 25.53% CV under the same conditions — up to 15× more variation.
  • Our system delivered 89.4% to 96.2% of the maximum allowed intensity as useful output across the room, versus 75.1% to 87.6% for the conventional layout.
  • In every room we tested, a substantially larger portion of the canopy stayed within 10% of the target light level with our system.
A more even light field means less wasted headroom and a more consistent environment for your crop.
This is the practical case for uniformity. It's not just about cleaner charts. It's about how much of your room is actually operating at the right light level once you account for real-world intensity limits.
Comparison chart of post-cap CV values for the proposed system and the conventional baseline across the four tested room geometries.
Light variation (CV) comparison across all four tested room sizes. Lower is better — our system stays well below 6% in every case, while the conventional layout climbs as high as 25%.
Comparison visual showing retained mean PPFD and near-mean coverage after the 1000 μmol m⁻² s⁻¹ cap is applied.
How much usable light output each system retains after applying a 1,000 μmol m⁻² s⁻¹ intensity cap, and how much of the canopy stays within 10% of the target level.

How It Was Evaluated

A head-to-head comparison under identical conditions

We designed the comparison to make sure the results reflected actual differences in light distribution — not differences in how the two systems were set up or what assumptions we made about them.

Both systems were tested in the same room geometries, measured with the same sensor grid, and compared at closely matched average light levels. Results were then reported under a shared intensity cap to mirror how growers actually operate their rooms.

Our primary simulation engine was Radiance, which is widely used in architectural and horticultural lighting research. We also ran a full cross-check using DIALux on a 12 ft × 12 ft reference room. The two tools agreed within 1.3% to 4.5% on all key metrics — which gives us confidence that the results are solid, not an artifact of the software we chose.

Workflow diagram showing layout generation, ring-isolated simulations, basis-matrix solver, target mean PPFD assignment, and field evaluation.
A walkthrough of our simulation and optimization pipeline — from generating the fixture layout to assigning zone-level intensities and evaluating the final light field.
Compact comparison visual showing Radiance versus DIALux agreement for key scale-invariant field-shape ratios in the reference room.
Agreement between Radiance and DIALux on the 12 ft × 12 ft reference room — confirming the results hold across both simulation tools.

What this paper covers

This paper is focused on one thing: how well light is distributed at the canopy level. It covers light field quality, controllability, and how the system scales across different room sizes and shapes. It's intended for growers, facility designers, and anyone evaluating how lighting architecture affects what plants actually receive — not just what fixtures are rated to emit.

The Bottom Line

Lighting performance is about more than fixture output

The core insight here is simple: how intelligently light is distributed matters just as much as how much light a fixture can produce.

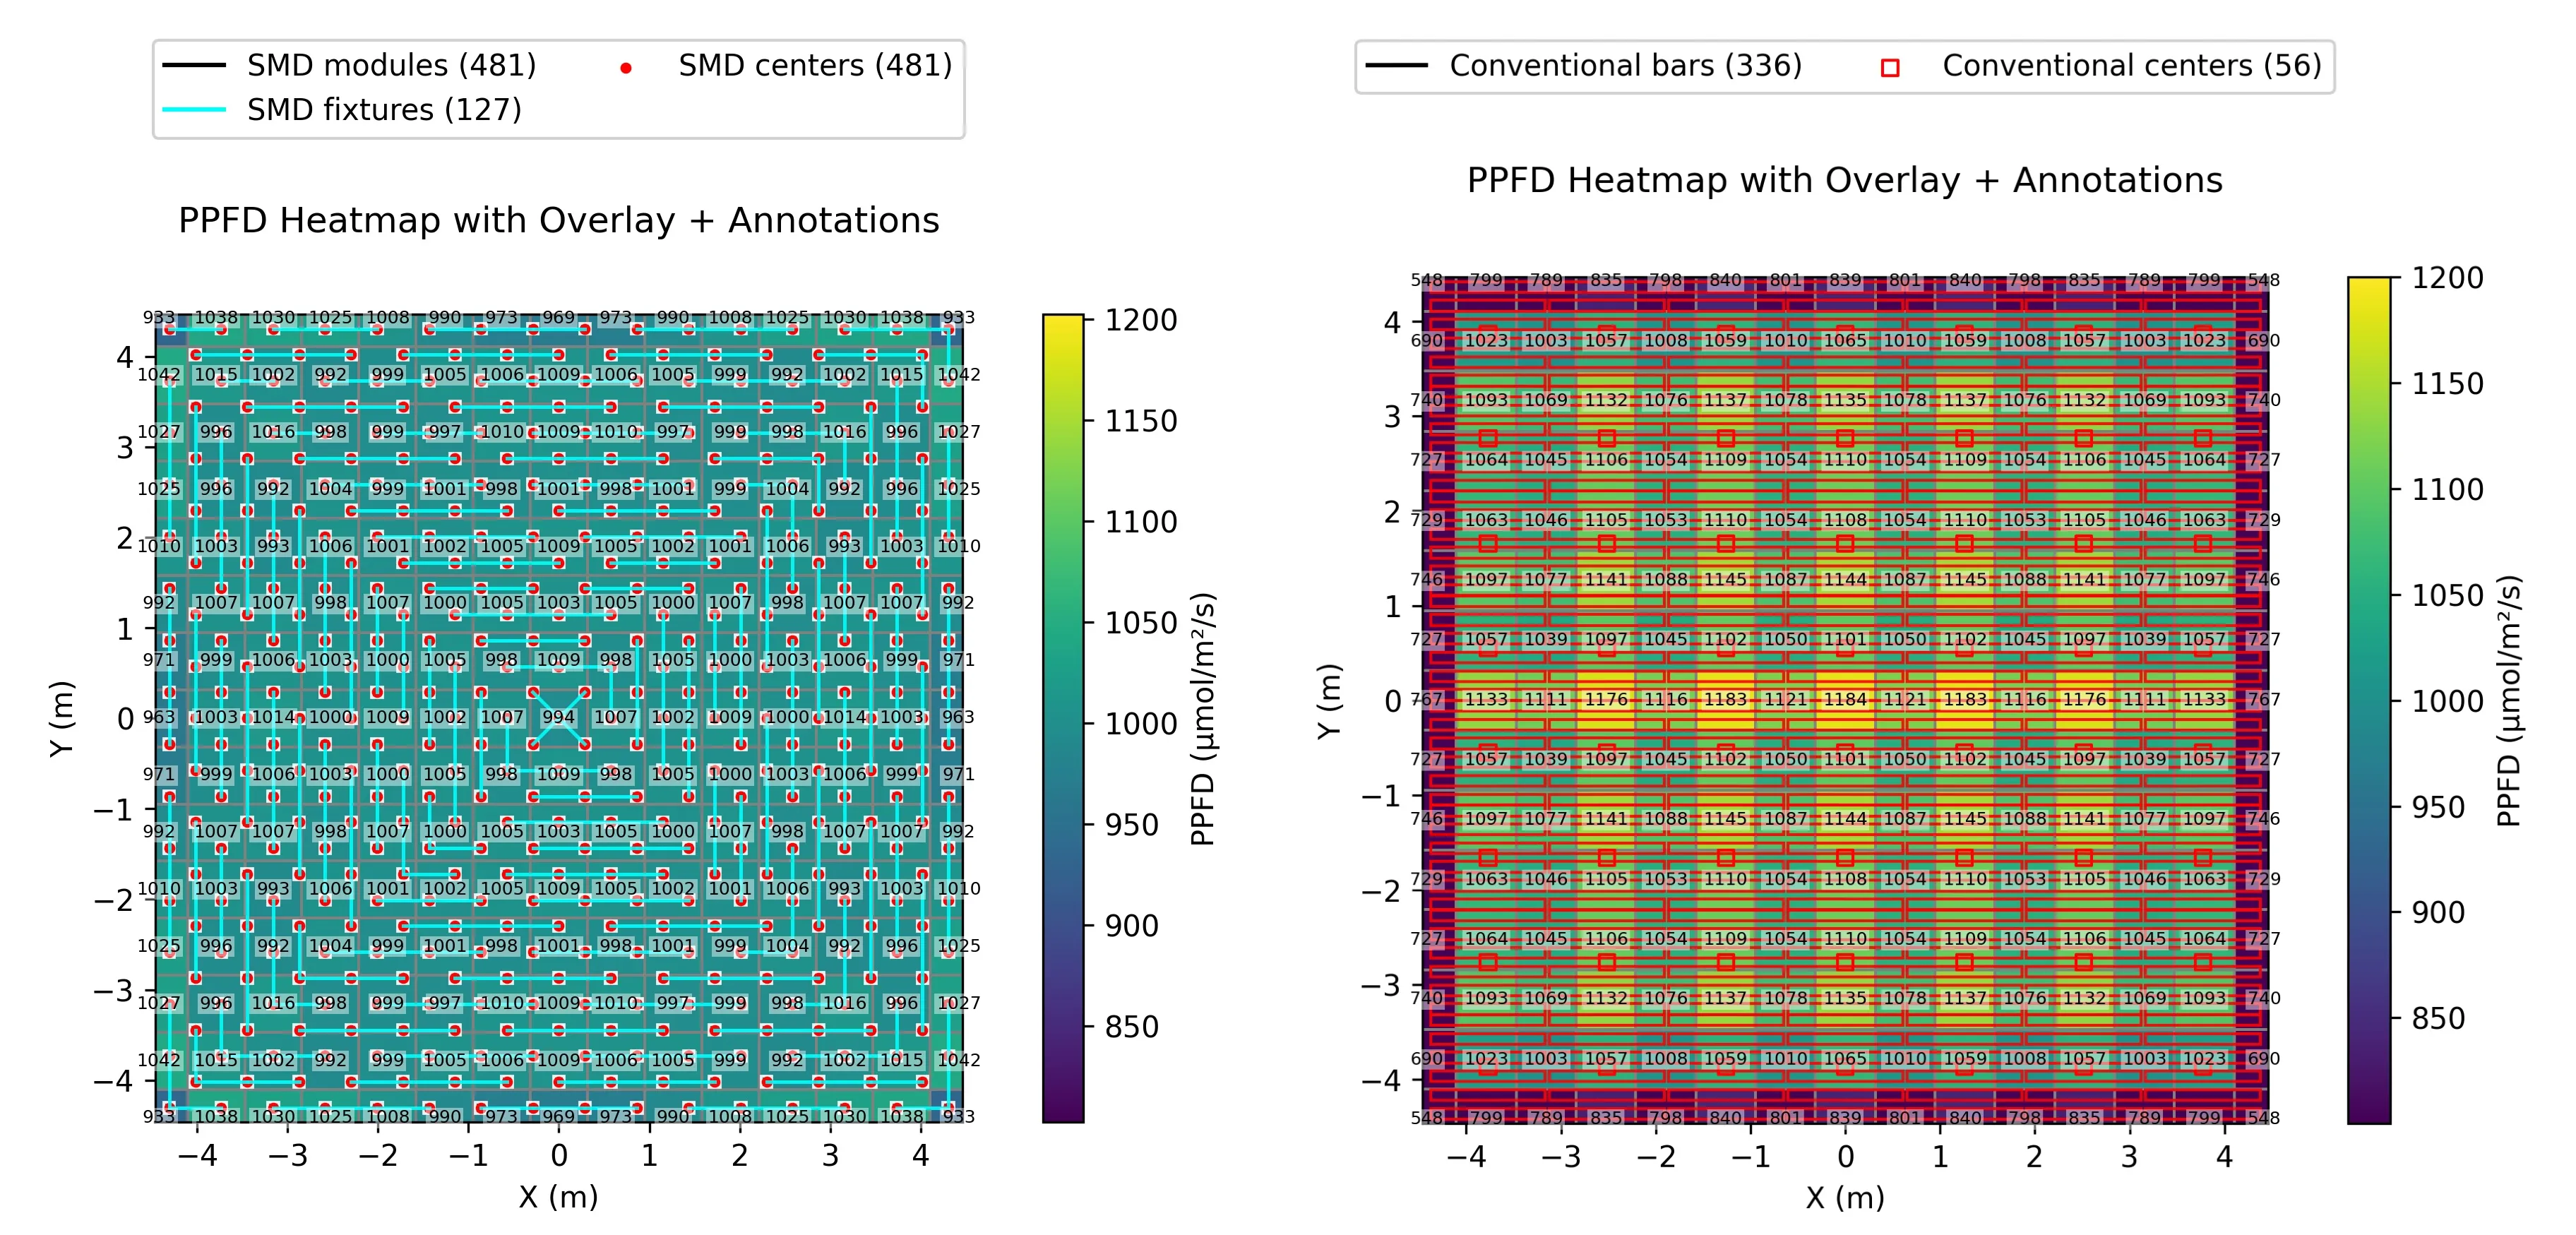
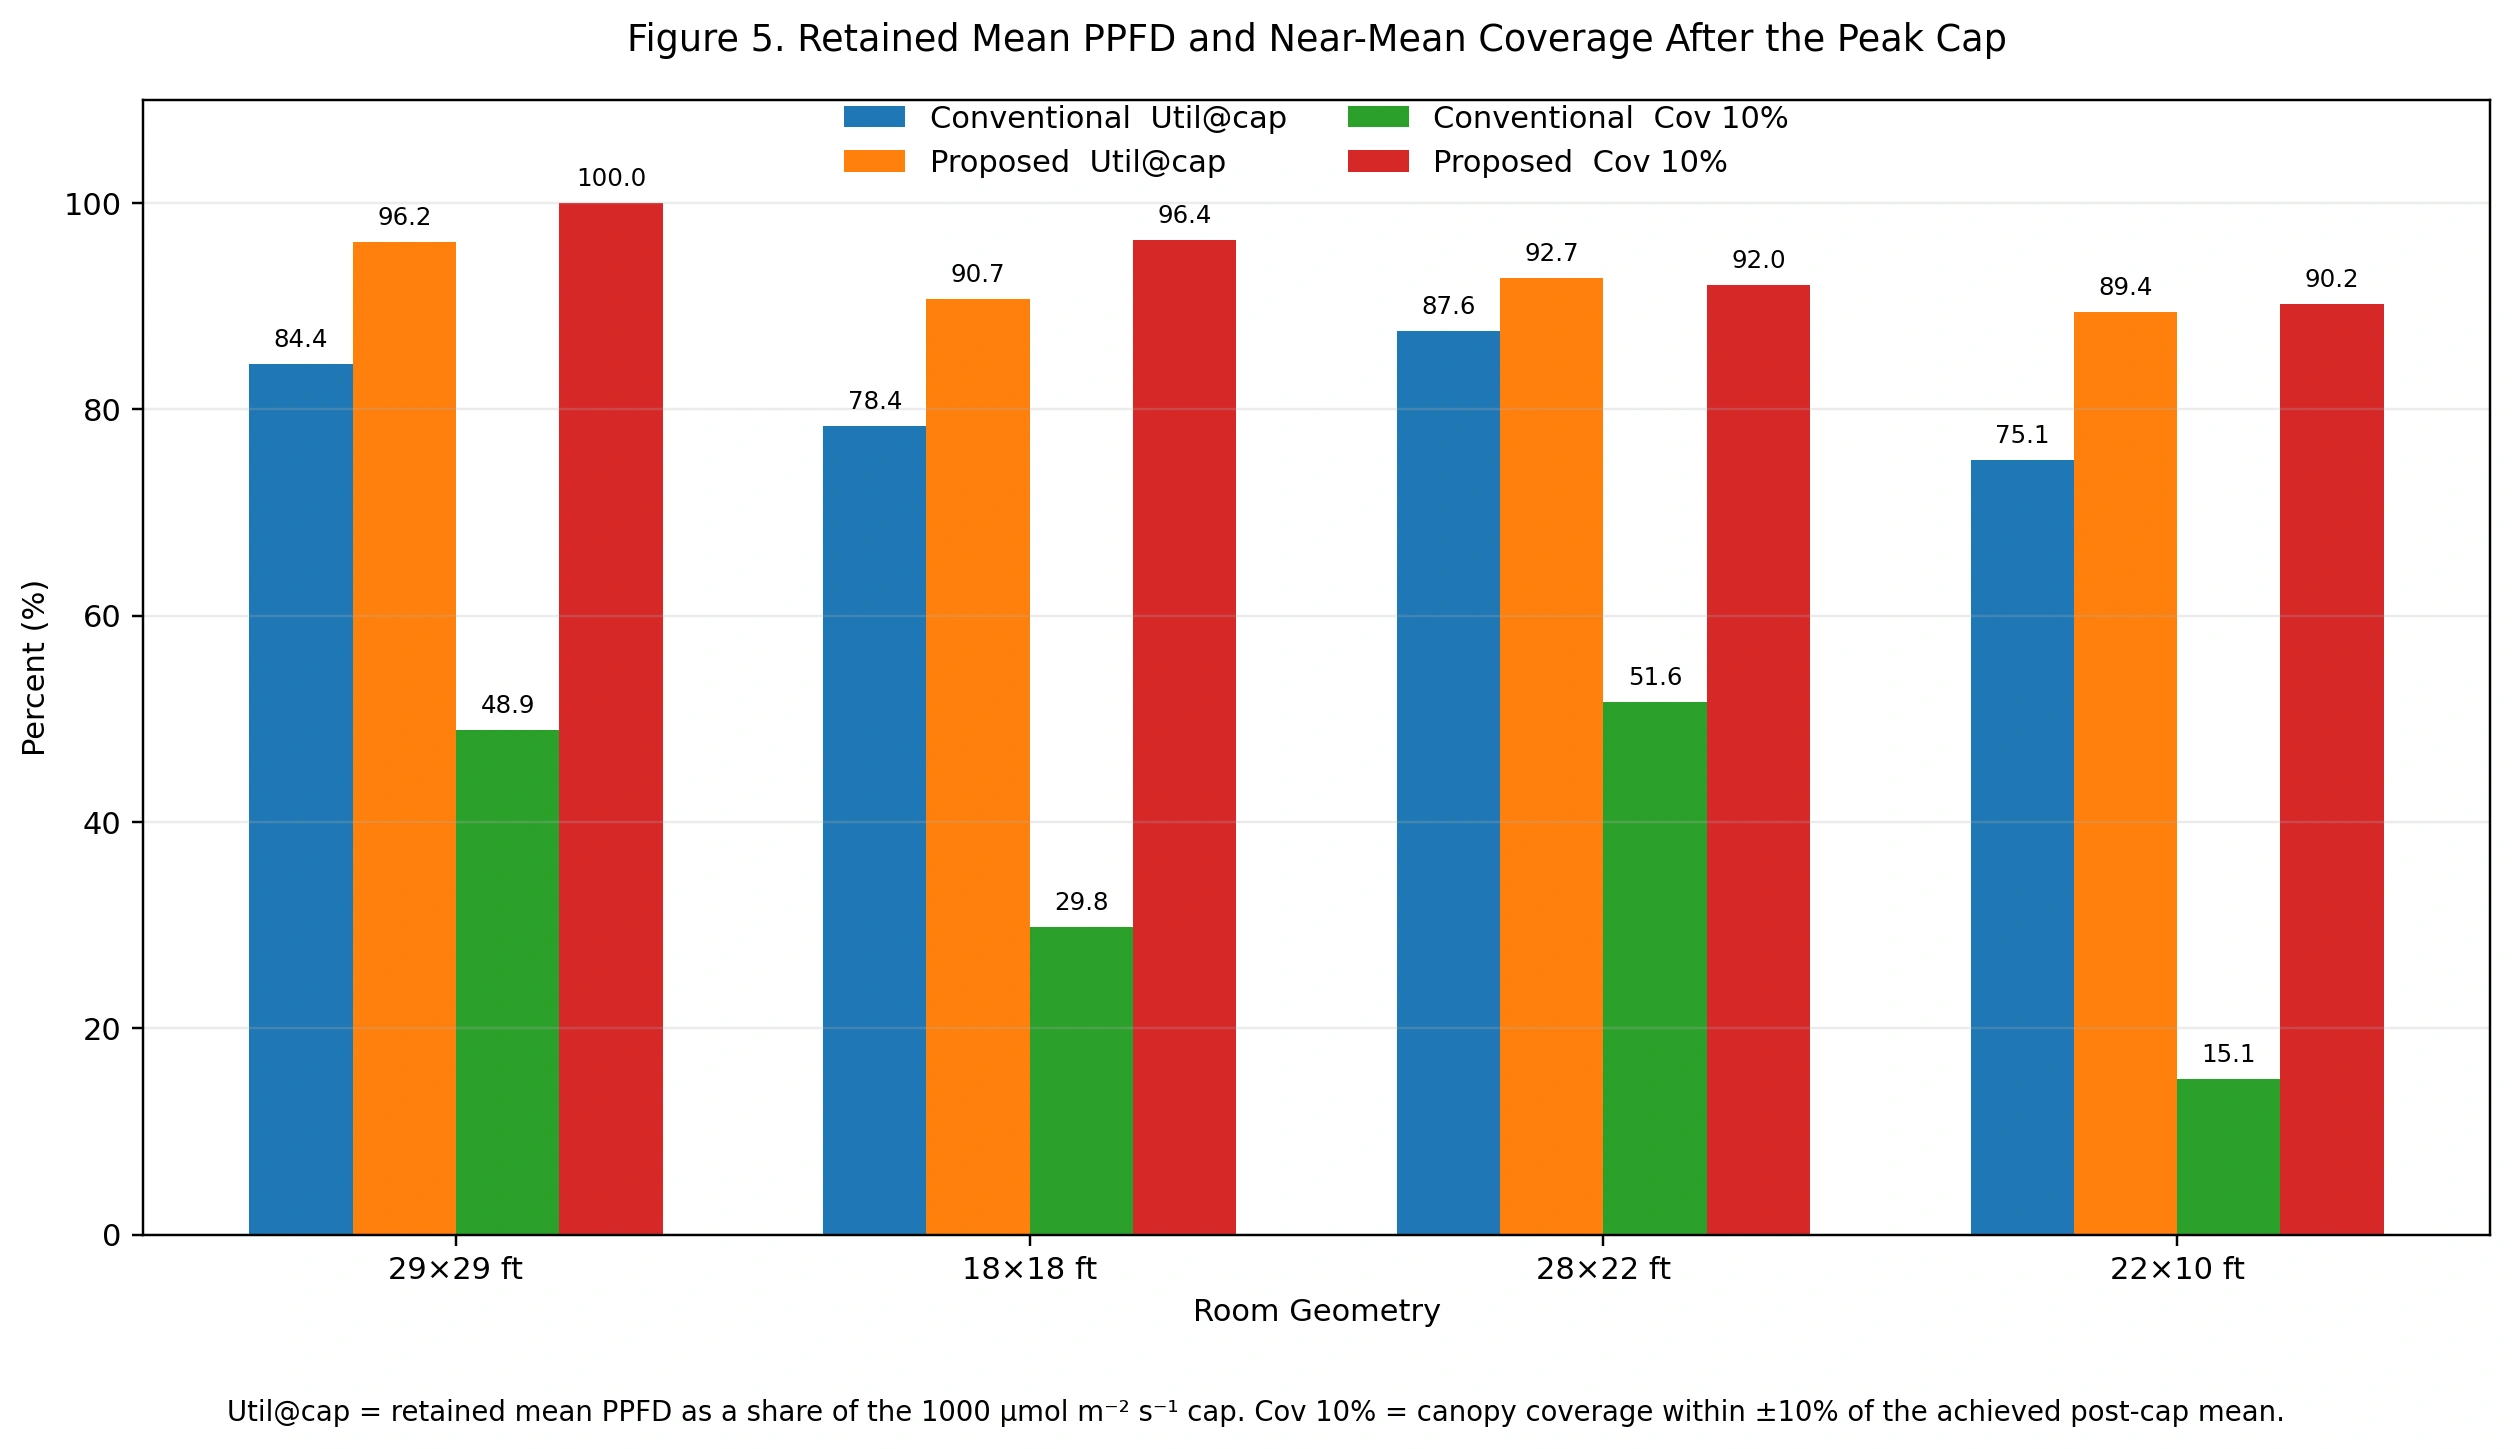
Conventional fixture layouts can perform well when room dimensions, fixture spacing, and control strategy happen to line up. But in practice, they often don't — and when they don't, light distribution suffers and the room becomes genuinely difficult to tune.

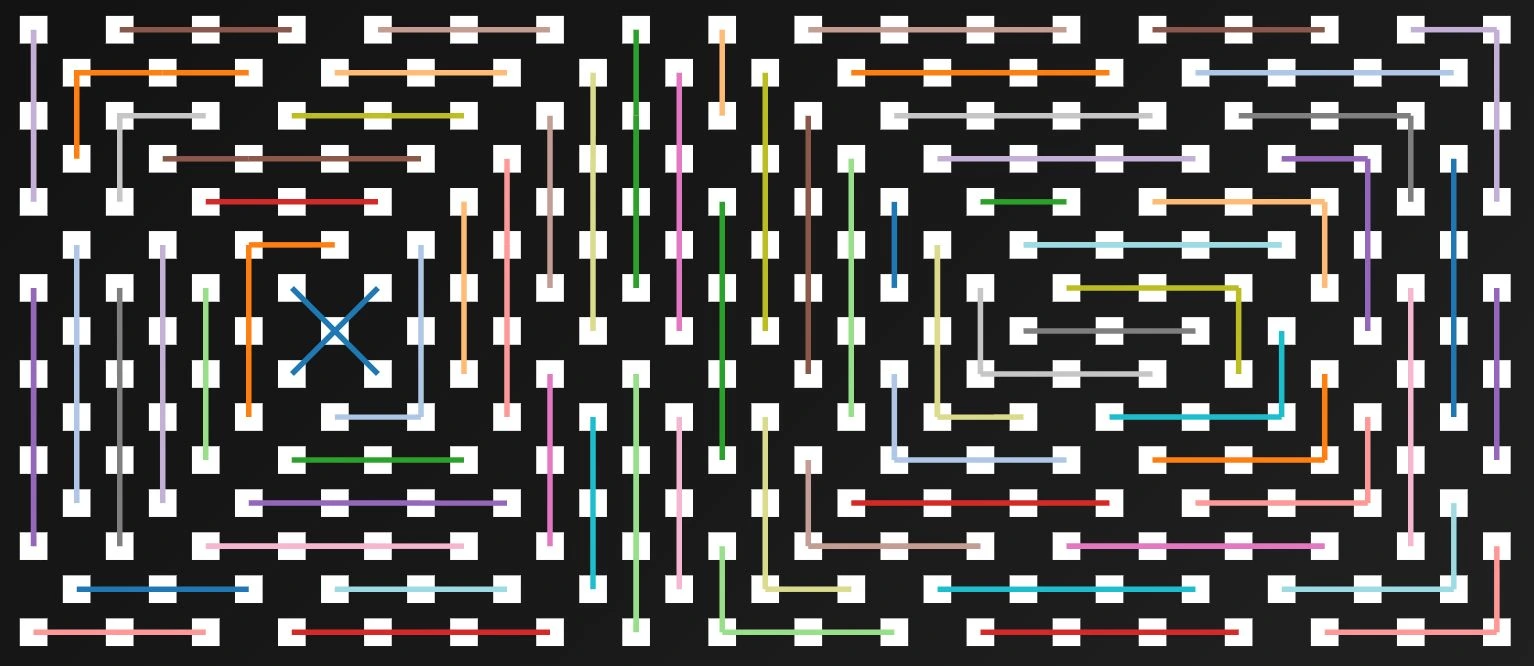
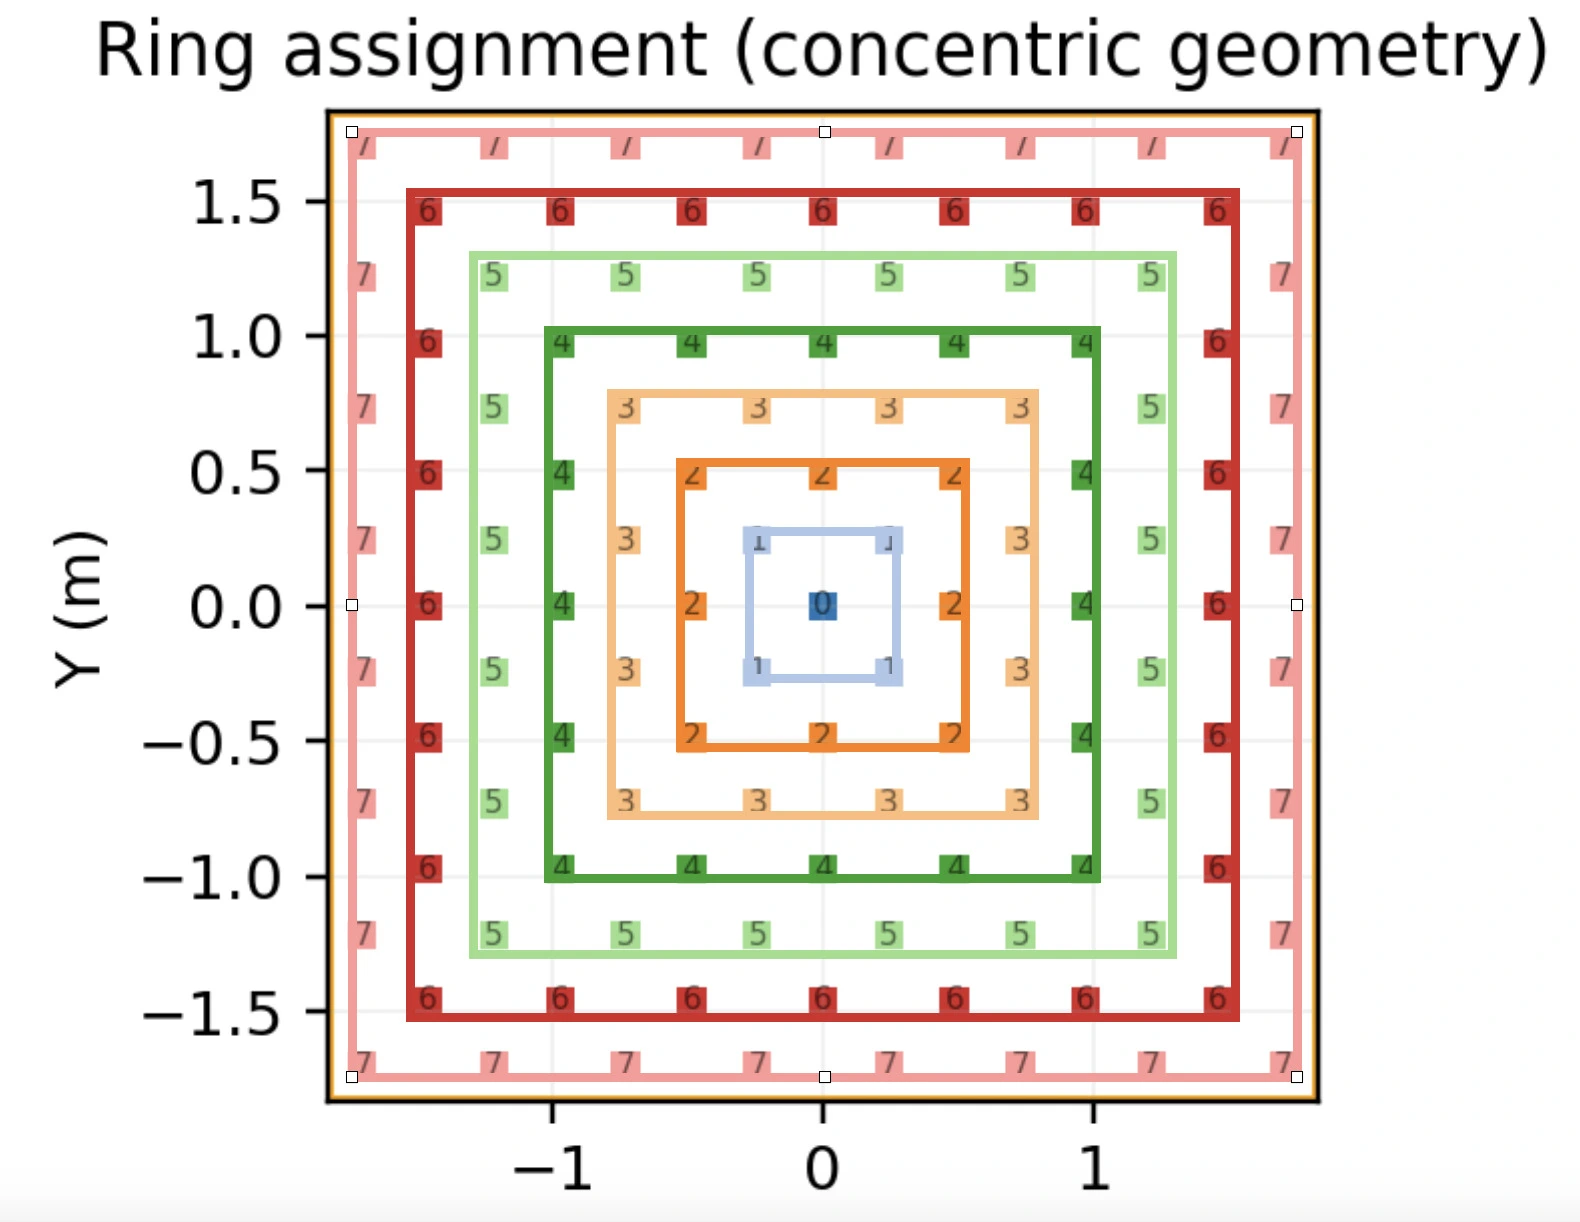
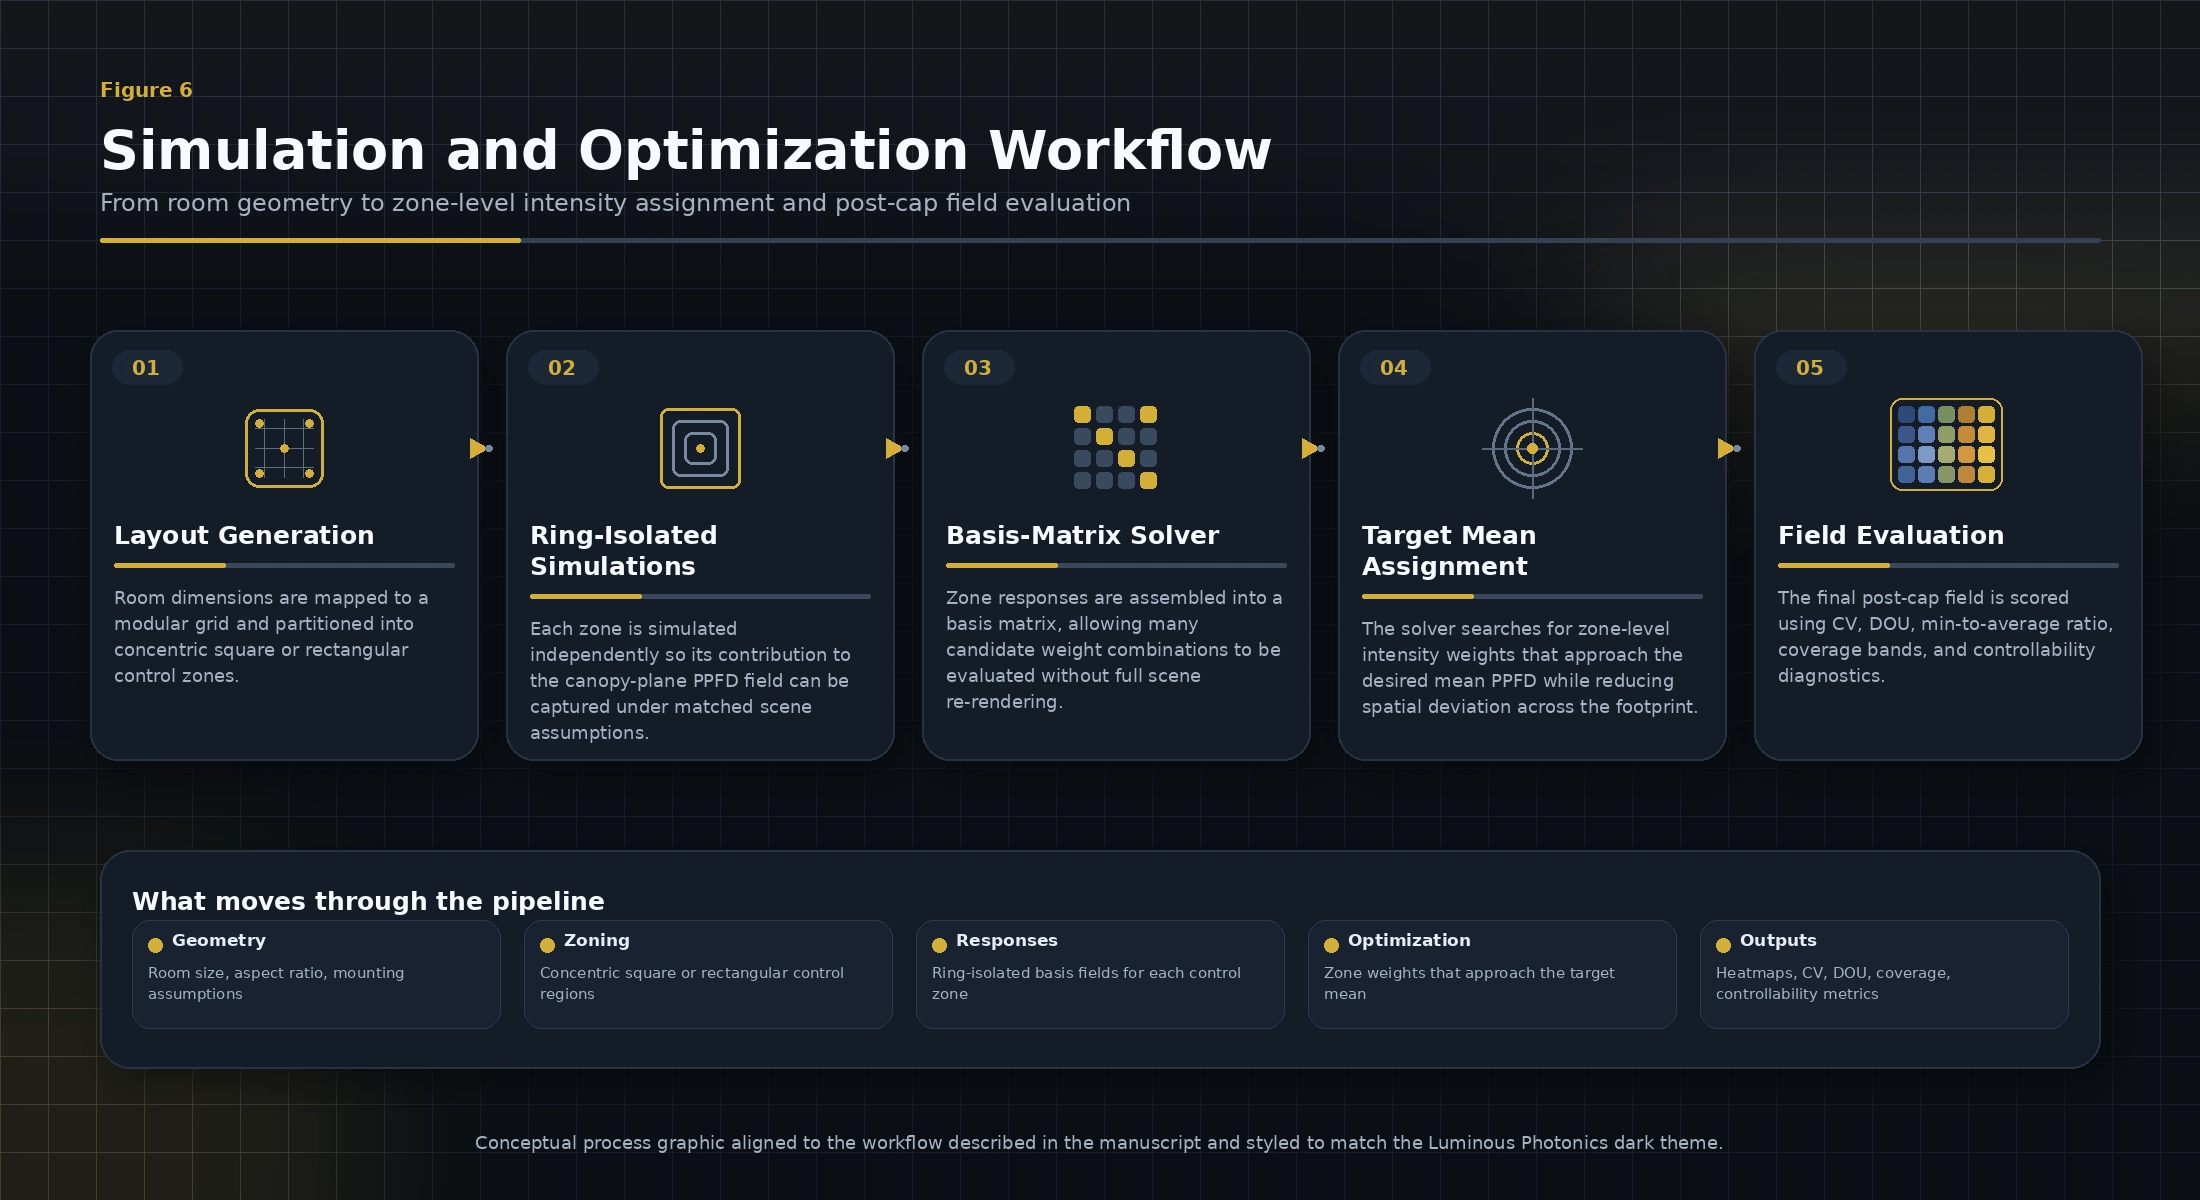
The modular, concentric-zone approach we evaluated here offers a more reliable path. It treats fixture placement, zone grouping, and intensity control as a single integrated system rather than three separate decisions made at different times. The result is a lighting architecture that adapts to different room geometries without requiring a complete redesign every time.

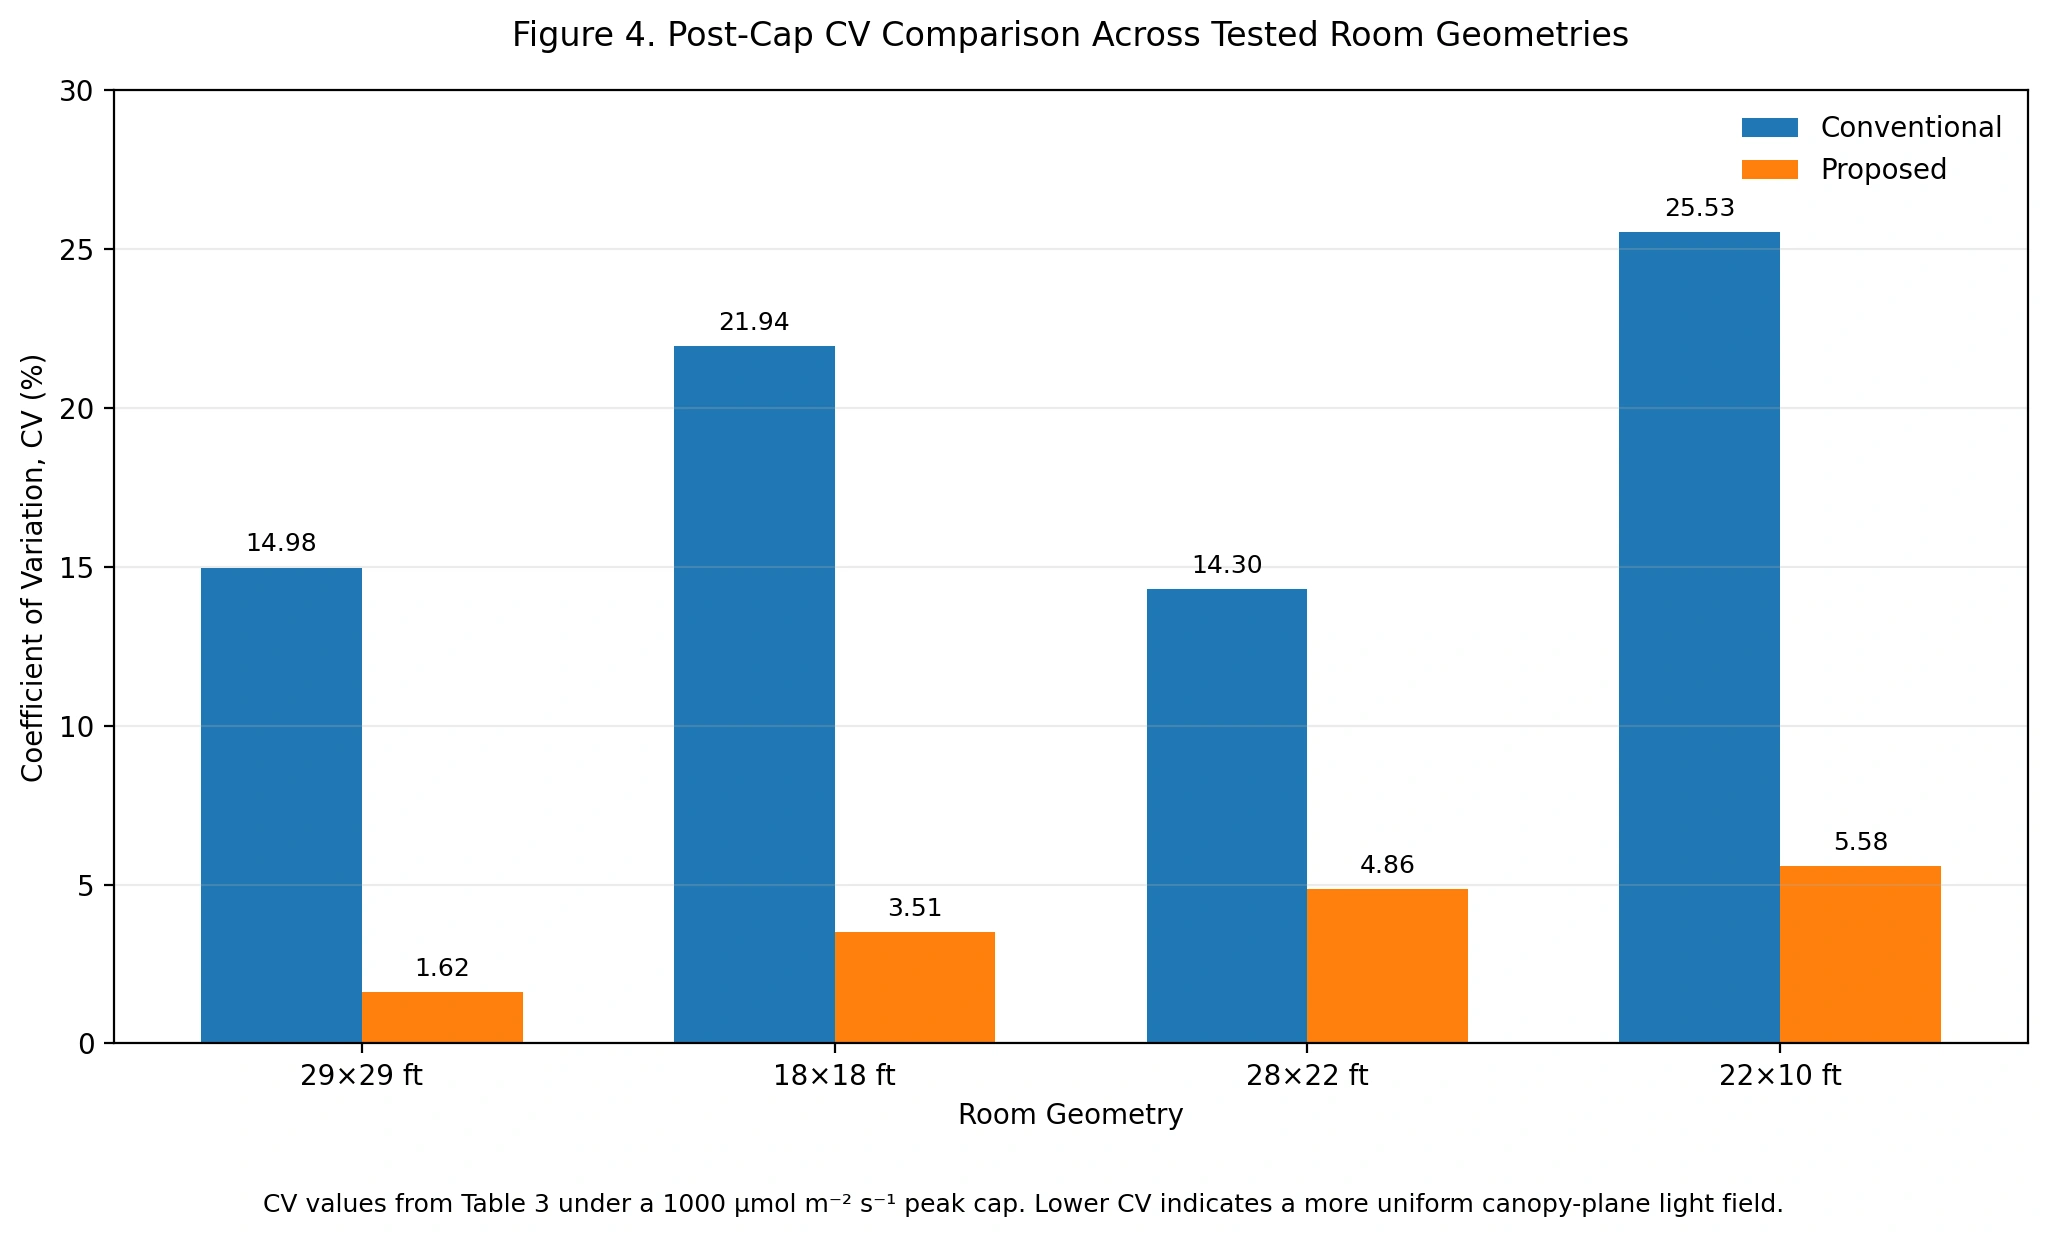
For growers, the practical benefit is straightforward: more of your grow area operates at the light level you actually intended. For designers, it means room size and shape become inputs the system can work with — not constraints that break the layout.

Want to learn more about the research or the system behind it?

Luminous Photonics is building a new generation of horticultural lighting around the principles described in this paper — scalable geometry, zone-level control, and consistent light delivery across the entire grow area.

Explore More Research
Pull me!